A decade of solar power
Ten years of solar power: growth, the installed mix and scale, country rankings and distribution, the cost race and how a system is built.
About this deck
For anyone presenting the energy transition. With public data from Our World in Data and Ember, shown as line, Sankey, treemap and map charts, it covers how much solar grew in ten years, where it grew, and why the grid has to change with it.
13 slides in the mono-studio style with the amber colours, built from 13 PCafe templates. The slides are in Chinese. Play it in the browser, download it as HTML, PowerPoint or PDF, or embed it in your own page.
What’s inside
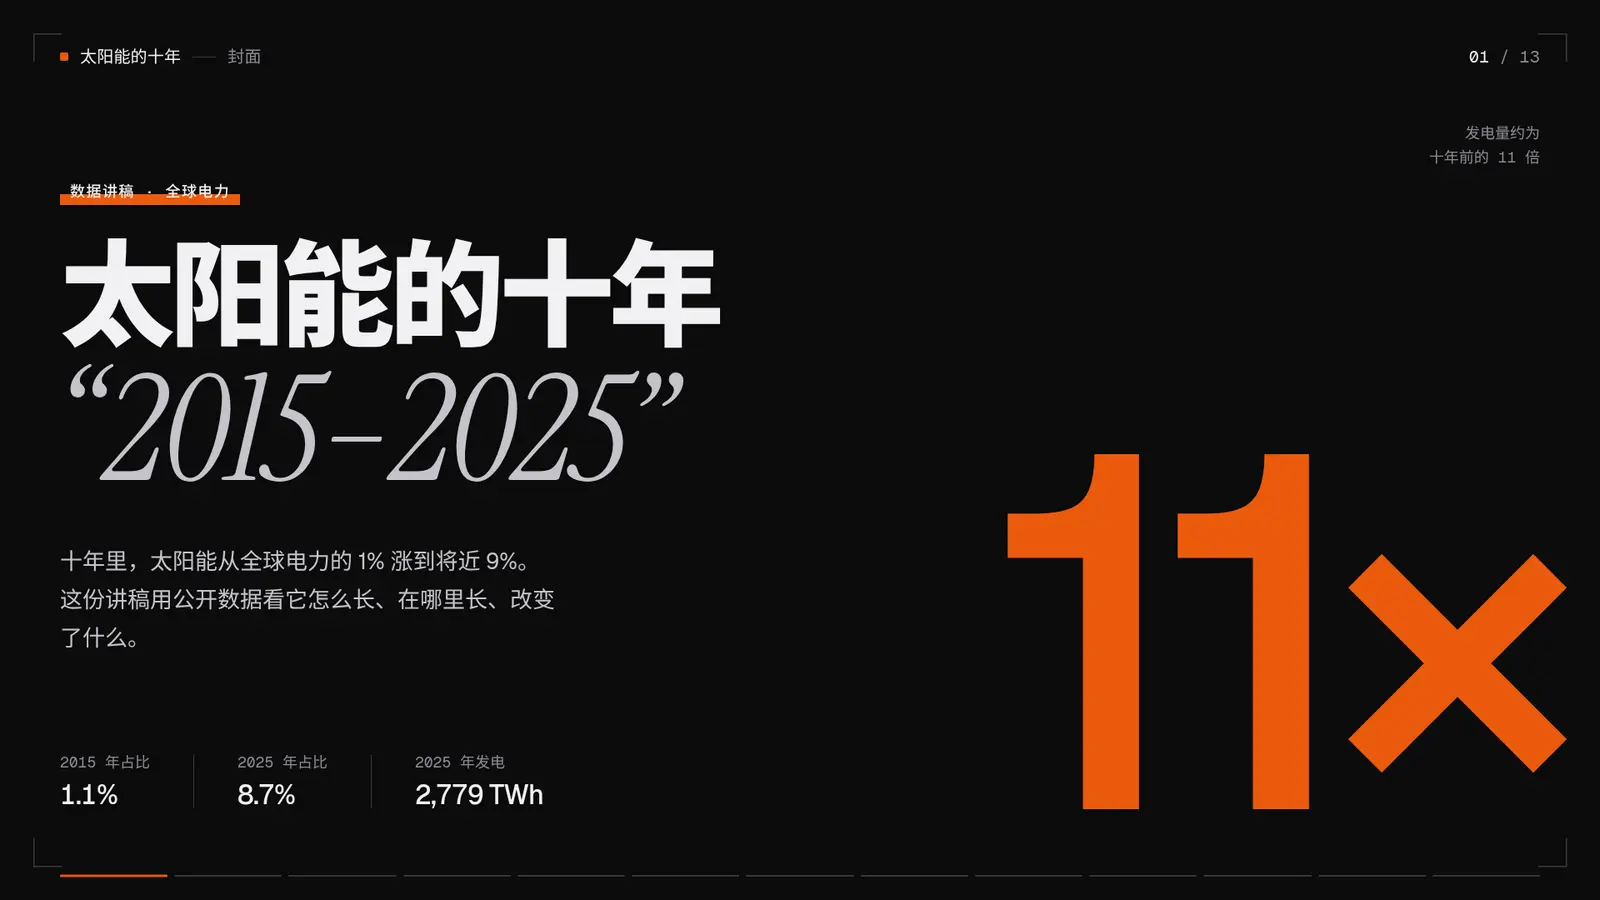
太阳能的十年 “2015–2025”
十年里,太阳能从全球电力的 1% 涨到将近 9%。这份讲稿用公开数据看它怎么长、在哪里长、改变了什么。
先记住三个数
全球太阳能发电在 2025 年再创新高,增速仍接近三成。
十年涨到约 11 倍
2019 年后,每年的增量都在变大:2025 年新增约 636 TWh,是 2015 年全年总量的两倍多。
全球电力从哪里来
2000–2025 年各类电源占全球发电的比例。煤电份额在缩小,顶上的太阳能层在变厚。
和其他电源比,它有多大
2025 年各类电源发电量,面积与发电量成正比。
2025 年的全球发电量怎么拆
八类电源汇成化石和低碳两股,再合成全年约 3.18 万 TWh。
谁发的太阳能电最多
按 → 每次前进两年。2015 年前五名几乎并列,十年后中国一家超过后面五家之和。
2025 年的太阳能电在哪里发
全球 2,779 TWh 按国家拆开,前九个国家约占八成,其余国家合计约两成。
前八名在地图上
2025 年太阳能发电量前八的国家,圆点面积与发电量成正比。
后来者追得有多快
每个点是一个国家:横轴是 2015 年太阳能占本国发电的比例,纵轴是 2025 年。虚线是全球平均。
两种不同的电力结构
2025 年各类电源占本国发电的比例。中国的太阳能总量最大,德国的太阳能占比更高。
太阳能越多,电网要补的课越多
光伏只在白天发电,比例越高,越需要其他环节配合。下图是示意,不含数据。
十年之后
全球太阳能发电从 256 TWh 涨到 2,779 TWh,约 11 倍。
Templates used
Each template has its own page: what it is for, its text limits and example code.
More demos
All demos →



Made with PCafe
Want a deck like this?
PCafe has your AI assistant write into ready-made slide templates. You get one HTML file that opens offline and can be sent to anyone.